

Housing Report — New Housing Units Sales
Home » Planning Topics » Housing » Housing Report » New Housing Units Sales
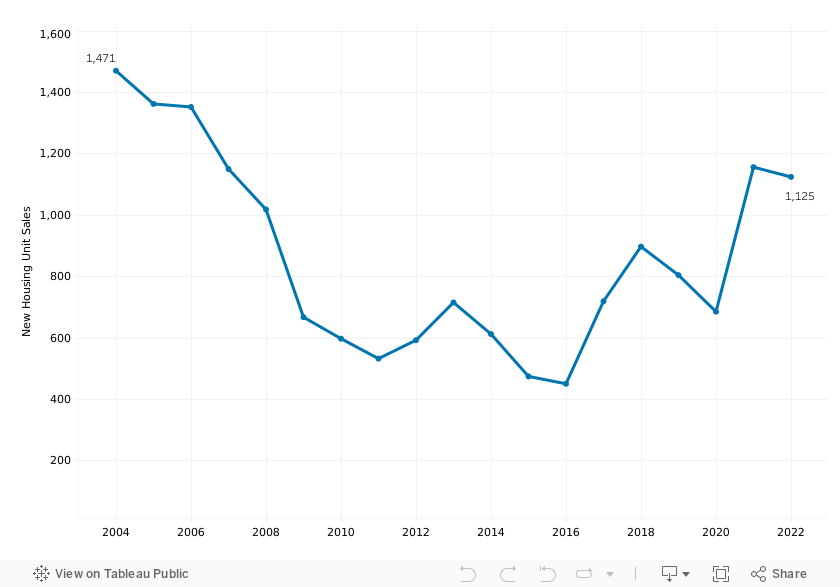
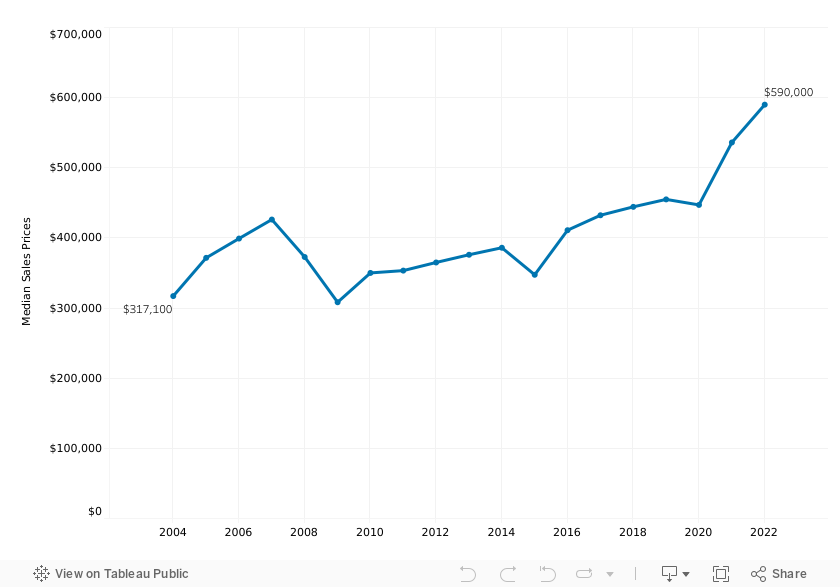
From 2021 to 2022 the number of new home sales decreased by 3%, and the median sale price increased by 10%.
New housing unit sales are presented from 2004, the year the Planning Commission began calculating data for new housing. Adjusting for inflation, median sale price increased by 3% from 2021 to 2022.
| Year | Number of Sales |
Percent Change |
Median Sale Price |
Percent Change |
Median Sale Price Inflation Adjusted |
Percent Change |
|---|---|---|---|---|---|---|
| 2004 | 1,471 | N/A | $317,100 | N/A | $494,558 | N/A |
| 2005 | 1,363 | -7.3% | $371,600 | 17.2% | $560,415 | 13.3% |
| 2006 | 1,353 | -0.7% | $399,100 | 7.4% | $586,976 | 4.7% |
| 2007 | 1,151 | -14.9% | $426,200 | 6.8% | $602,253 | 2.6% |
| 2008 | 1,019 | -11.5% | $372,800 | -12.5% | $526,314 | -12.6% |
| 2009 | 668 | -34.4% | $308,300 | -17.3% | $423,723 | -19.5% |
| 2010 | 598 | -10.5% | $350,100 | 13.6% | $474,081 | 11.9% |
| 2011 | 533 | -10.9% | $353,400 | 0.9% | $464,781 | -2.0% |
| 2012 | 593 | 11.3% | $365,000 | 3.3% | $471,822 | 1.5% |
| 2013 | 716 | 20.7% | $376,000 | 3.0% | $478,851 | 1.5% |
| 2014 | 613 | -14.4% | $386,000 | 2.7% | $487,895 | 1.9% |
| 2015 | 475 | -22.5% | $347,450 | -10.0% | $435,988 | -10.6% |
| 2016 | 451 | -5.1% | $411,000 | 18.3% | $505,250 | 15.9% |
| 2017 | 720 | 59.6% | $432,305 | 5.2% | $520,464 | 3.0% |
| 2018 | 898 | 24.7% | $444,305 | 2.8% | $524,885 | 0.8% |
| 2019 | 805 | -10.4% | $454,936 | 2.4% | $525,437 | 0.1% |
| 2020 | 686 | -14.8% | $447,056 | -1.7% | $509,398 | -3.1% |
| 2021 | 1,157 | 68.7% | $536,124 | 19.9% | $570,728 | 12.0% |
| 2022 | 1,125 | -2.8% | $590,000 | 10.0% | $590,000 | 3.4% |
Of 73 municipalities in Chester County, 23% sold more than 20 new units, 11% added 10-20, 32% added 1-10, and 34% had no new units. Phoenixville had the highest number of new units, with 110 new units sold in 2022.
For median sales prices of municipalities with over three new home sales, 6% were under $300,000, 6% were $300,000 to $399,999, and 88% were over $400,000. Three municipalities had median sales prices of over one million dollars for new homes (Easttown, West Bradford, and Tredyffrin).
After a low of 451 new home sales in 2016, new home sales saw large increases through 2018. New home sales decreased in both 2019 and 2020, then increased significantly in 2021, by 28.8%. New home sales in 2022 remained consistent with 2021.
New unit home sale median prices have been trending upwards since 2008. Previously, the median new unit sale price reached a high of $536,124 in 2021. In 2021 the median sales price for new homes increased even further to $590,000, an all time high.
Of the 1,157 new unit home sales in Chester County, 29% were sold between $250,000-$499,999. The number of new unit sales in the most affordable price range of less than $250,000 decreased from 17 units in 2021 to 11 in 2022, remaining at 1% of total new sales.
| Price Range | 2021 Number All Sales |
2021 Percent All Sales |
2022 Number All Sales |
2022 Percent All Sales |
|---|---|---|---|---|
| Less than $250,000 | 17 | 1% | 11 | 1% |
| $250,000 - $499,999 | 497 | 43% | 331 | 29% |
| $500,000 - $749,999 | 453 | 39% | 527 | 47% |
| $750,000 - $899,999 | 120 | 10% | 144 | 13% |
| $900,000 - $1,499,999 | 62 | 5% | 94 | 8% |
| $1,500,000 and over | 8 | 1% | 18 | 2% |
| Total | 1157 | 100.0% | 1125 | 100.0% |
Downingtown, West Goshen, East Coventry, and East Fallowfield had the highest increases in the number of new housing sales. East Whiteland, West Vincent, and East Pikeland had the largest decreases in number of new home sales.
Malvern, Tredyffrin, and Willistown all had the highest increases in median sales price for new units. East Whiteland, East Nottingham, and West Chester had the largest decreases in median sale price for new units. Median sales price for municipalities with three or fewer sales of new homes in 2020 were omitted.
| Municipality | 2022 New Units, Number of Sales |
2022 New Units, Median Price |
2021 New Units, Number of Sales |
2021 New Units, Median Price |
Change in Number of Units, 2021-2022 |
Change in Median Price 2021-2022 |
|---|---|---|---|---|---|---|
| Atglen | 0 | * | 0 | * | 0 | * |
| Avondale | 0 | * | 0 | * | 0 | * |
| Birmingham | 0 | * | 0 | * | 0 | * |
| Caln | 32 | $499,043 | 2 | * | 30 | * |
| Charlestown | 14 | $713,171 | 22 | $741,944 | -8 | ($28,773) |
| Coatesville | 1 | * | 1 | * | 0 | * |
| Downingtown | 36 | $545,174 | 53 | $494,063 | -17 | $51,111 |
| East Bradford | 53 | $760,385 | 39 | $723,466 | 14 | $36,919 |
| East Brandywine | 51 | $480,010 | 76 | $472,743 | -25 | $7,268 |
| East Caln | 40 | $507,015 | 9 | $420,000 | 31 | $87,015 |
| East Coventry | 0 | * | 27 | $312,434 | -27 | * |
| East Fallowfield | 18 | $506,325 | 39 | $431,535 | -21 | $74,790 |
| East Goshen | 1 | * | 0 | * | 1 | * |
| East Marlborough | 59 | $552,320 | 65 | $508,175 | -6 | $44,145 |
| East Nantmeal | 0 | * | 0 | * | 0 | * |
| East Nottingham | 11 | $515,450 | 7 | $426,260 | 4 | $89,190 |
| East Pikeland | 53 | $765,176 | 37 | $657,210 | 16 | $107,966 |
| East Vincent | 46 | $749,908 | 6 | $525,110 | 40 | $224,798 |
| East Whiteland | 12 | $687,460 | 85 | $619,335 | -73 | $68,125 |
| Easttown | 8 | $2,266,161 | 4 | $1,202,830 | 4 | $1,063,332 |
| Elk | 0 | * | 0 | * | 0 | * |
| Elverson | 1 | * | 13 | $242,110 | -12 | * |
| Franklin | 3 | * | 1 | * | 2 | * |
| Highland | 0 | * | 0 | * | 0 | * |
| Honey Brook Borough. | 0 | * | 2 | * | -2 | * |
| Honey Brook Twp | 0 | * | 38 | $377,848 | -38 | * |
| Kennett Square | 2 | * | 2 | * | 0 | * |
| Kennett Township | 0 | * | 14 | $652,158 | -14 | * |
| London Britain | 0 | * | 1 | * | -1 | * |
| London Grove | 12 | $657,508 | 24 | $594,758 | -12 | $62,750 |
| Londonderry | 10 | $584,210 | 12 | $424,200 | -2 | $160,010 |
| Lower Oxford | 15 | $459,140 | 9 | $406,000 | 6 | $53,140 |
| Malvern | 1 | * | 1 | * | 0 | * |
| Modena | 0 | * | 0 | * | 0 | * |
| New Garden | 7 | $480,103 | 13 | $402,238 | -6 | $77,865 |
| New London | 8 | $841,388 | 0 | * | 8 | * |
| Newlin | 0 | * | 1 | * | -1 | * |
| North Coventry | 3 | * | 0 | * | 3 | * |
| Oxford | 23 | $428,158 | 10 | $361,540 | 13 | $66,619 |
| Parkesburg | 2 | * | 0 | * | 2 | * |
| Penn | 46 | $448,050 | 38 | $390,758 | 8 | $57,293 |
| Pennsbury | 1 | * | 2 | * | -1 | * |
| Phoenixville | 110 | $450,158 | 23 | $485,000 | 87 | ($34,843) |
| Pocopson | 1 | * | 1 | * | 0 | * |
| Sadsbury | 46 | $339,683 | 26 | $344,973 | 20 | ($5,291) |
| Schuylkill | 5 | $523,019 | 10 | $471,449 | -5 | $51,570 |
| South Coatesville | 0 | * | 0 | * | 0 | * |
| South Coventry | 1 | * | 1 | * | 0 | * |
| Spring City | 17 | $551,965 | 0 | * | 17 | * |
| Thornbury | 0 | * | 1 | * | -1 | * |
| Tredyffrin | 9 | $1,018,396 | 43 | $729,495 | -34 | $288,901 |
| Upper Oxford | 0 | * | 0 | * | 0 | * |
| Upper Uwchlan | 102 | $647,578 | 96 | $665,715 | 6 | ($18,138) |
| Uwchlan | 0 | * | 1 | * | -1 | * |
| Valley | 4 | $230,000 | 2 | * | 2 | * |
| Wallace | 0 | * | 5 | $640,121 | -5 | * |
| Warwick | 0 | * | 0 | * | 0 | * |
| West Bradford | 1 | * | 52 | $566,130 | -51 | * |
| West Brandywine | 61 | $543,371 | 46 | $499,273 | 15 | $44,098 |
| West Caln | 3 | * | 2 | * | 1 | * |
| West Chester | 0 | * | 1 | * | -1 | * |
| West Fallowfield | 1 | * | 0 | * | 1 | * |
| West Goshen | 104 | $832,040 | 88 | $769,075 | 16 | $62,965 |
| West Grove | 5 | $225,000 | 0 | * | 5 | * |
| West Marlborough | 0 | * | 0 | * | 0 | * |
| West Nantmeal | 0 | * | 1 | * | -1 | * |
| West Nottingham | 0 | * | 2 | * | -2 | * |
| West Pikeland | 0 | * | 0 | * | 0 | * |
| West Sadsbury | 0 | * | 3 | * | -3 | * |
| West Vincent | 1 | * | 2 | * | -1 | * |
| West Whiteland | 62 | $535,705 | 89 | $489,174 | -27 | $46,531 |
| Westtown | 1 | * | 2 | * | -1 | * |
| Willistown | 22 | $824,648 | 7 | $1,299,000 | 15 | ($474,352) |
| Chester County | 1125 | $590,000 | 1157 | $536,124 | -32 | $53,876 |