
Housing Report — County Data
Home » Planning Topics » Housing » Housing Report » County Data
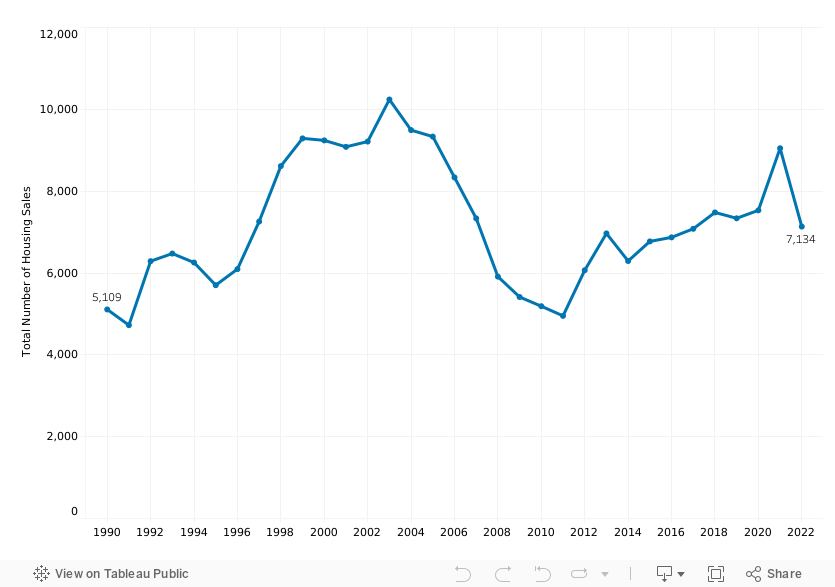
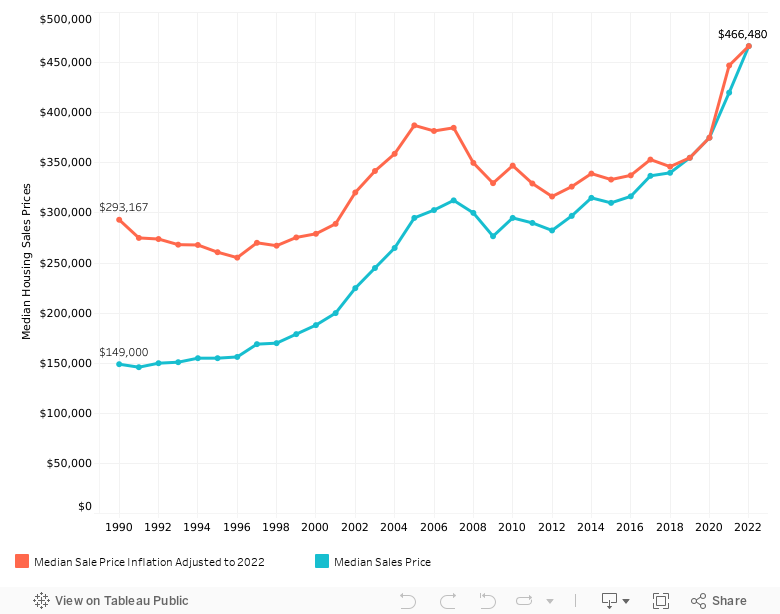
The volume of sales in 2022 decreased significantly from 2021, to the lowest in five years. Demand for housing remained high in the county, driving the median sales price to $466,480, the highest ever in Chester County.
| Year | Number of Sales |
Percent Change |
Median Sale Price |
Percent Change |
Median Sale Price Inflation Adjusted to 2022 |
Percent Change Median Sale Price Inflation Adjusted to 2022 |
|---|---|---|---|---|---|---|
| 2022 | 7,134 | -4.6% | $466,480 | 11.1% | $466,480 | 4.3% |
| 2021 | 9,049 | 20.1% | $420,000 | 12.0% | $447,108 | 4.6% |
| 2020 | 7,532 | 0.7% | $375,064 | 5.7% | $427,367 | 4.2% |
| 2019 | 7,337 | -1.9% | $355,000 | 4.4% | $410,014 | 2.1% |
| 2018 | 7,480 | 5.6% | $340,000 | 0.9% | $401,663 | -1.0% |
| 2017 | 7,080 | 3.0% | $337,000 | 6.5% | $405,724 | 4.3% |
| 2016 | 6,871 | 1.5% | $316,500 | 2.1% | $389,080 | 0.0% |
| 2015 | 6,772 | 7.6% | $310,000 | -1.6% | $388,995 | -2.3% |
| 2014 | 6,293 | -9.7% | $315,000 | 6.1% | $398,153 | 5.3% |
| 2013 | 6,967 | 14.8% | $297,000 | 5.1% | $378,241 | 3.6% |
| 2012 | 6,067 | 22.5% | $282,500 | -2.6% | $365,178 | -4.3% |
| 2011 | 4,952 | -4.5% | $290,000 | -1.7% | $381,399 | -4.5% |
| 2010 | 5,188 | -4.2% | $295,000 | 6.6% | $399,469 | 5.0% |
| 2009 | 5,413 | -8.4% | $276,700 | -7.8% | $380,292 | -10.2% |
| 2008 | 5,911 | -19.4% | $300,000 | -4.0% | $423,536 | -4.1% |
| 2007 | 7,335 | -12.0% | $312,500 | 3.2% | $441,587 | -0.8% |
| 2006 | 8,336 | -10.7% | $302,800 | 2.6% | $445,343 | 0.1% |
| 2005 | 9,333 | -1.7% | $295,000 | 11.3% | $444,894 | 7.6% |
| 2004 | 9,492 | -7.3% | $265,000 | 8.2% | $413,301 | 4.8% |
| 2003 | 10,240 | 11.2% | $245,000 | 8.9% | $394,548 | 6.9% |
| 2002 | 9,212 | 1.4% | $224,900 | 12.5% | $368,986 | 9.8% |
| 2001 | 9,083 | -1.7% | $200,000 | 6.4% | $335,933 | 4.8% |
| 2000 | 9,241 | -0.5% | $188,000 | 5.0% | $320,677 | 1.6% |
| 1999 | 9,290 | 7.9% | $179,000 | 5.3% | $315,666 | 2.5% |
| 1998 | 8,613 | 18.7% | $170,000 | 0.6% | $307,843 | -1.0% |
| 1997 | 7,257 | 19.1% | $169,000 | 8.2% | $310,965 | 6.3% |
| 1996 | 6,095 | 6.9% | $156,250 | 0.8% | $292,399 | -2.4% |
| 1995 | 5,702 | -8.9% | $155,000 | 0.0% | $299,697 | -2.5% |
| 1994 | 6,256 | -3.4% | $155,000 | 2.6% | $307,305 | -0.0% |
| 1993 | 6,475 | 3.0% | $151,000 | 0.7% | $307,382 | -2.0% |
| 1992 | 6,289 | 33.1% | $150,000 | 2.7% | $313,739 | -0.2% |
| 1991 | 4,725 | -7.5% | $146,000 | -2.0% | $314,230 | -4.9% |
| 1990 | 5,109 | -15.6% | $149,000 | 2.8% | $330,514 | N/A |
There were 7,134 total sales in 2022. Home sales peaked in 2003 at 10,240, before declining to a low of 4,952 sales in 2011. Sales have been generally increasing since the 2011 low.
Both raw and inflation adjusted median sales prices saw significant increases during the early 2000s, then decreased from 2008 to 2009, likely due to the 2008 recession. The raw median home sale price continued to increase from 2010 to 2022.
The inflation adjusted median sales price had been remaining steady from 2010 to 2019, but increased in 2020 through 2022. The 2022 median home sale price, both raw and inflation adjusted to 2022 dollars, was the highest it has ever been 30 years.
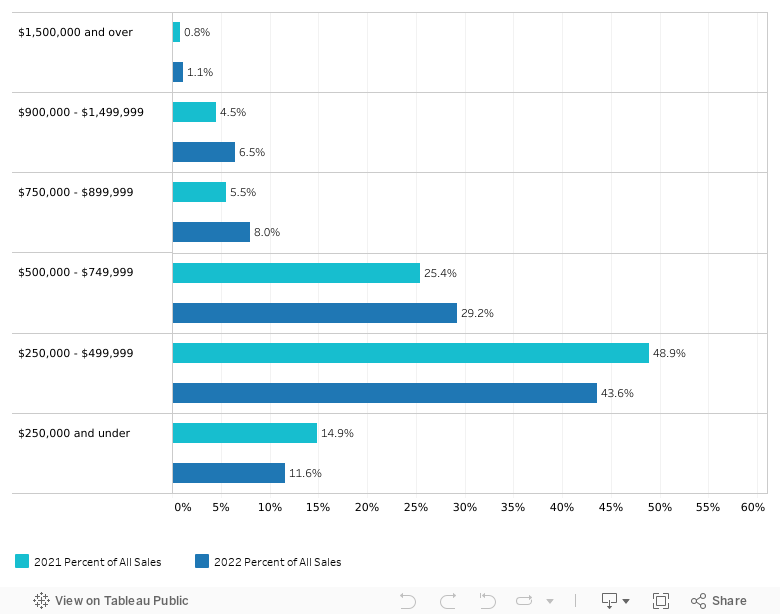
Home sales under $250,000, the most affordable range, continued to decrease in 2022, for the fourth year in a row. In 2022, the $250,000 - $499,999 range remained the range with the largest number of home sales at 43.6% of Chester County homes sales. The number of homes sales over $750,000 increased to 15.6% in 2022, up from 10.8% in 2021.
| Home Sale Price Range | 2021 All Sales | 2021 Percent of All Sales | 2022 All Sales | 2022 Percent of All Sales |
|---|---|---|---|---|
| Less than $250,000 | 1,347 | 14.9% | 827 | 11.6% |
| $250,000 - $499,999 | 4,422 | 48.9% | 3,111 | 43.6% |
| $500,000 - $749,999 | 2,300 | 25.4% | 2,081 | 29.2% |
| $750,000 - $899,999 | 502 | 5.5% | 574 | 8.0% |
| $900,000 - $1,499,999 | 405 | 4.5% | 463 | 6.5% |
| $1,500,000 and over | 73 | 0.8% | 78 | 1.1% |
| Total | 9,049 | 100.0% | 7,134 | 100.0% |
The share of home sales further increased in higher price ranges from 2021 to 2022. The $250,000-$499,999 range decreased in share by 5.3%, $500,000-$749,999 increased by 3.8%. The most affordable less than $250,000 range decreased in share by 3.3%.