

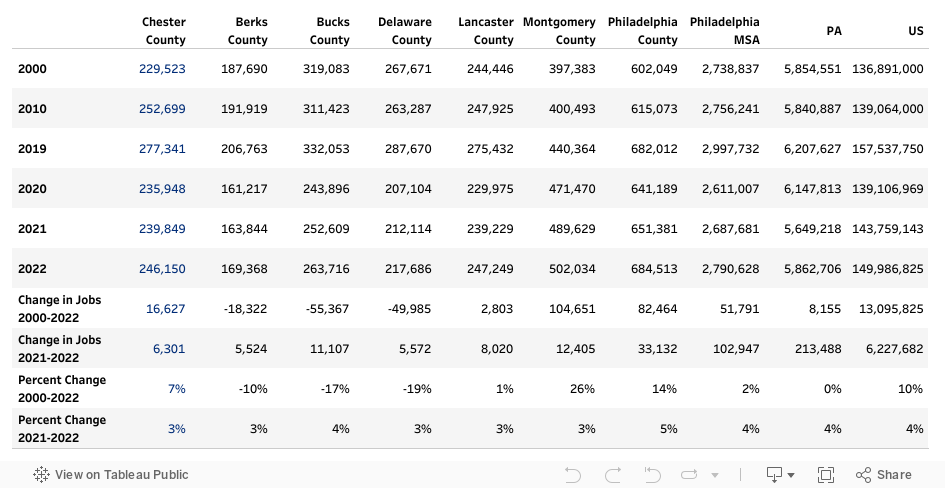
Figure 18 — Percent Change in Employment, 2000-2024
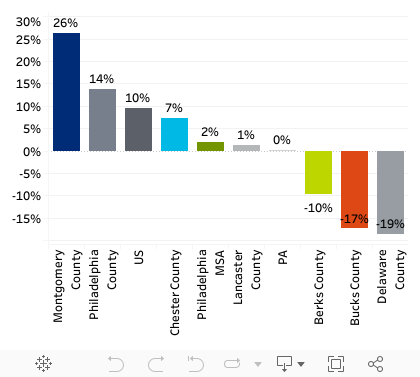
Source: U.S. Bureau of Labor Statistics
Employment by Industry, 2024
Chester County's employment is concentrated in service and professional industries.
Chester County's employment is broken into broad industry categories by the federal government called NAICS codes. Health care, professional service, finance, retail, and education employ the highest number of people in the county. Job totals can vary by source and year, and the most current data for detailed industry breakdown is from 2024.
Figure 19 — Employment by Major Industy
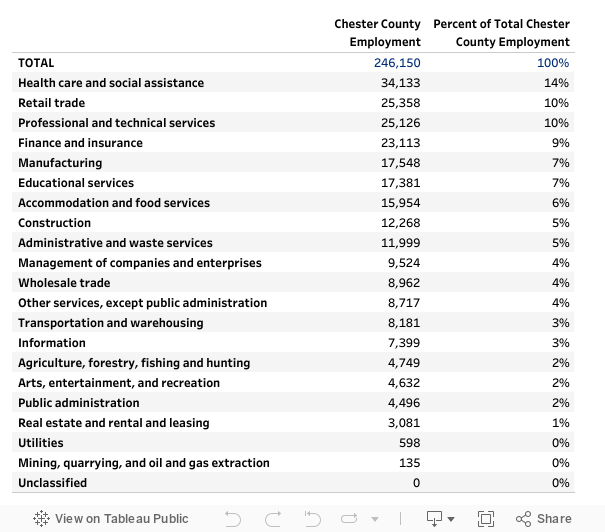
Source: U.S. Bureau of Labor Statistics
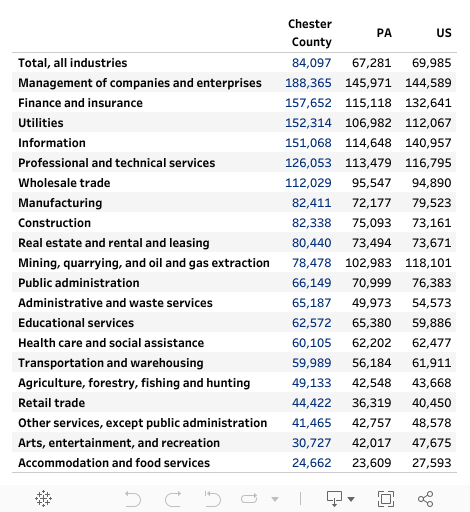
Chester County has an exceptionally high share of the state's employment in many industries. Agriculture has a particularly large share at 17 percent, largely due the mushroom industry. Finance also has a large share at nine percent, largely due to Vanguard. Information, professional and technical services, and management of companies and enterprises all have large shares of Pennsylvania's employment, especially when compared to population size.
Figure 20 —County Percent of PA Employment, 2024
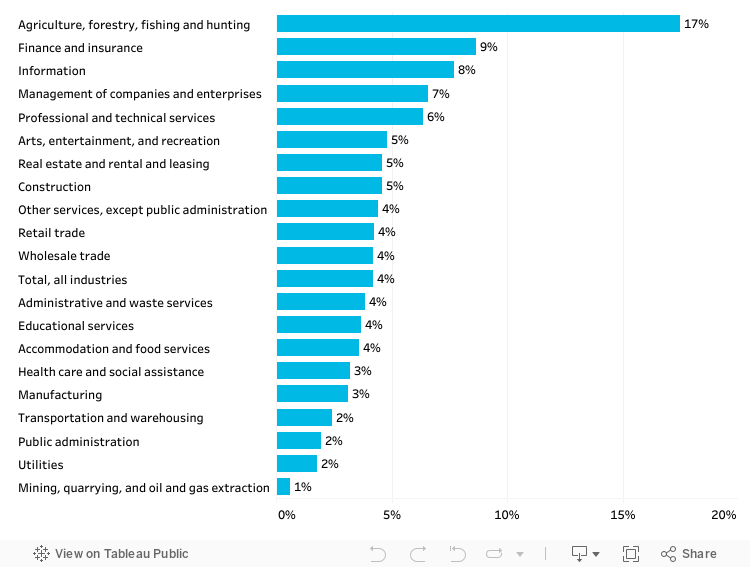
Source: U.S. Bureau of Labor Statistics
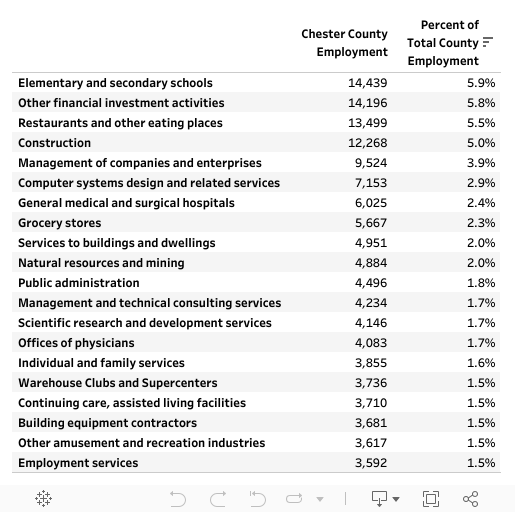
Looking more specifically at individual four-digit NAICS codes, the largest number of employees in 2023 were in elementary and secondary schools, other financial investment activities, and restaurants.
Figure 21 — Top 20 Specific Industries, 2024
Source: U.S. Bureau of Labor Statistics
Wages by Industry
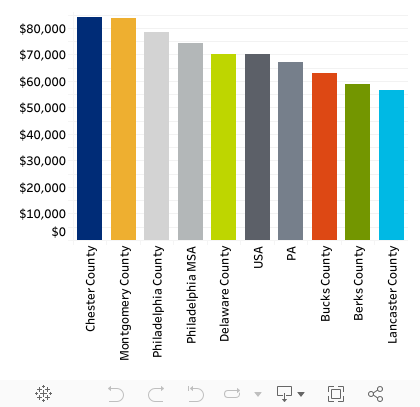
Chester County had a high overall average wage in 2024 of $85,308, up from $87,841 in 2023. The county has the second highest annual average wage in Southeast Pennsylvania, only exceeded by Montgomery County whose wages averaged $88,444 and both were far higher than Pennsylvania or the U.S.
High Chester County wages are largely driven by the management, utilities, finance, and information industries. Other large industries, such as public administration, education, administrative and waste services, and health care have average wages closer to state and national figures.
Figure 22 — Average Annual Wages by Major Industry, 2024
Source: U.S. Bureau of Labor Statistics
Figure 23 — Average Wages, 2024
Source: U.S. Bureau of Labor Statistics
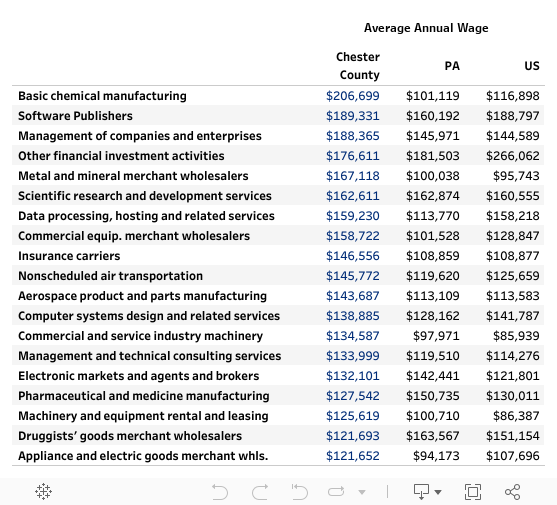
Chester County has many strong industries with particularly high average annual wages. Specific industries that tract significantly higher than both the US and PA include metal and mineral merchant wholesalers ($49,017 higher than the US), insurance carriers ($47,780 higher), basic chemical manufacturing ($39,626 higher), and management or companies and enterprises ($37,929 higher).
While many Chester County industries are high for the state, they on average track lower than the US as a whole. Chester County's highest average specific industry wage is securities and commodity contracts brokerage, which had an average income of $265,335 — lower than PA ($292,164) and the US ($301,135).
Figure 24 — Average Annual Wages by Specific Industry (50+ Employees) Industry, 2024
Source: U.S. Bureau of Labor Statistics
This table only includes 4-digit NAICS code industries with over 50 employees.
Employment Location Quotient by Industry
Chester County has strong competitive advantages in finance, agriculture, company management, and professional services.
The employment location quotient compares the portion of jobs in an industry in Chester County with the portion of jobs in the nation. For industries where Chester County mimics the national ratio exactly, the location quotient will be 1. When the county has a higher share of jobs than the nation, the location quotient will be greater than 1. Location quotients higher than 1 indicate that the industry is exporting goods or services outside of the county. Location quotients of less than 1 mean the county has a lower share of jobs, which indicates that the county is importing goods or services from that industry
Figure 25 — Employment Location Quotient for Major Industries, 2024
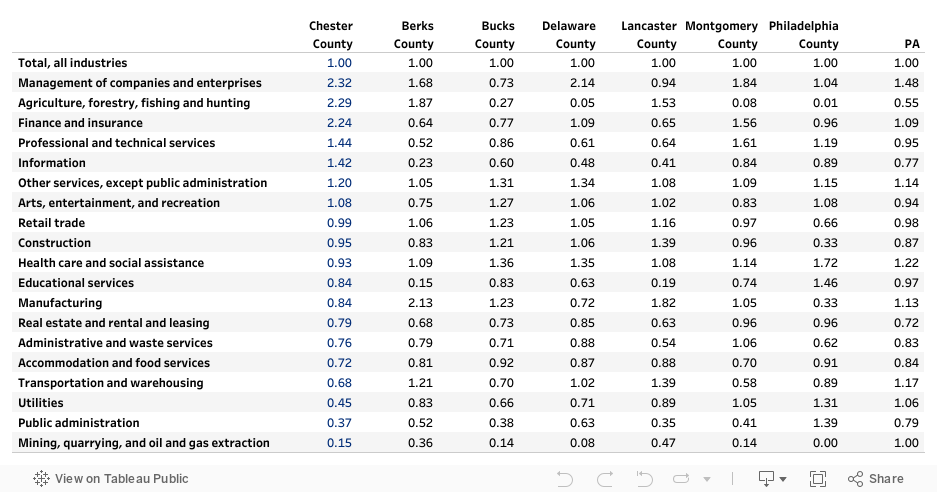
Source: U.S. Bureau of Labor Statistics
The majority of specific industries with high location quotients fall into key industry groups identified by the Chester County Economic Development Council (additional information in the Key Industry section). Chester County has extraordinarily high location quotients for other financial investment activities and greenhouse and nursery production, indicating that the County is exporting these goods and services nationally and potentially internationally. Both nursery production and financial investment have multiple significant employers in the County, indicating Chester County has attracted and formed clusters of these industries. These cluster industries have generated spin-off industries such as agricultural chemical manufacturing, another industry with a high location quotient, a result of the strong mushroom industry in the county.
Other high location quotients are driven by one major employer. Examples of this include school and employee bus transportation with Krapf Transportation, and household appliance manufacturing with Lasko Products.
Chester County also showed strength in communications and equipment manufacturing, fuel dealers, civic and social organizations, other animal production, scientific research and development services, and software publishers.
Figure 26 — Top 20 Employment Location Quotient for Specific Industries (50+ employes), 2024
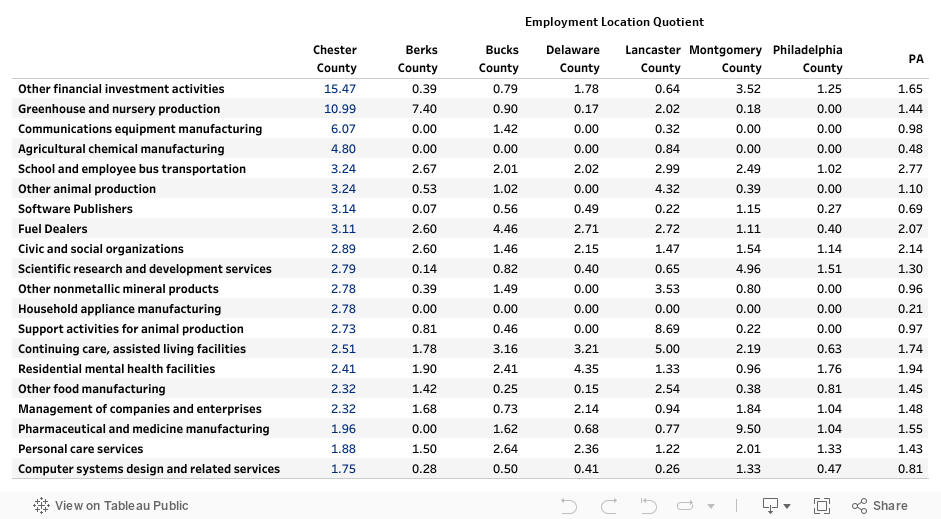
Source: U.S. Bureau of Labor Statistics
This table only includes 4-digit NAICS code industries with over 50 employees.
Employment Shift Share Analysis by Industry
A shift share analysis removes the influence of national overall and industry employment changes from the actual local change that occurred, to estimate an "expected" local change in employees due to local factors. While not important in themselves, the "expected" local change numbers can be used to identify potential strengths and weaknesses at the local level. However, the analysis cannot identify the causes of the change. Unique local factors influencing employment change vary and may include:
- Labor Force Specialization The area may have a labor force with specific industry skills.
- Educational Feeders Schools and colleges can increase labor force specialization and generate spin-offs.
- Local Assets Local natural or historical characteristics may cause industry specialization.
- Large Employers Major employers opening, terminating employees, or closing in a local area will impact changes in employment.
- Industry Clusters Areas may develop strengths in an industry, which supports future growth in the industry.
- Industry Support Industries may open to support existing strong industries, such as produce distribution centers to support restaurants or farms.
- Industry Externalities Industries may develop to handle the externalities of other prominent businesses, such as compost as a result of farm refuse.
- Technology Changes Advances in technological efficiencies may cause decreases in employment at the local level.
- Cost-Of-Living Costs such as housing and transportation costs can assist or stymie industry growth.
- Major Events Events and festivals can cause increases in industry employment.
- Population Growth Local growth can increase demand for industries such as construction as new housing is needed.
- Government Intervention Local government policy, taxes, and assistance can grow or hinder industries.
- Local Disaster Natural disasters, epidemics, and man-made disasters at the local level can cause increases or decreases in employment.
- National Clusters Strong clusters in other areas of the country (such as tech jobs in California) may cause disproportionate national growth
The analysis should be combined with additional analyses and local knowledge to understand the unique local factors influencing employment change. From 2015-2024 Chester County showed indications of strong employment growth due to local factors for: local messengers and delivery, finance (nondepository credit intermediation), educational support services, vegetable and melon farming, household good repair and maintenance, and furniture and furnishing merchant wholesalers.
Chester County saw indicators of employment decline due to local factors largely in manufacturing and distribution industries. The industries with the highest indications of decline due to local factors from 2015-2024 were machinery and equipment rental and leasing, semiconductor and electronic component manufacturers, and druggists' goods merchant wholesalers.
Figure 27 — Specific Industries with Higest Indications of Growth Due to Local Factors, 2024
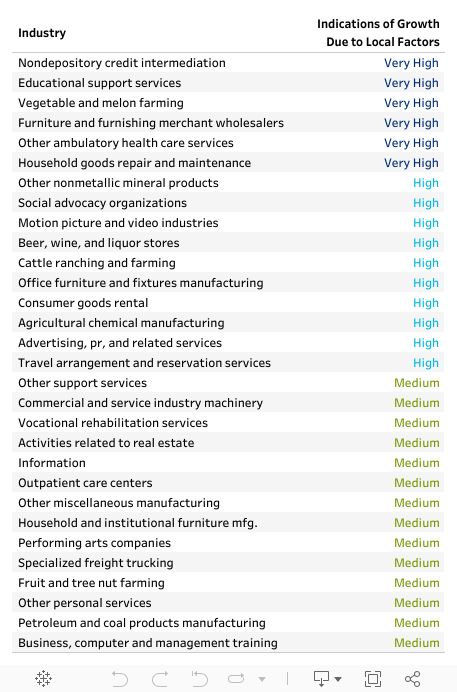
Source: U.S. Bureau of Labor Statistics
This table only includes 4-digit NAICS code industries with over 50 employees.
Figure 28 — Specific Industries with Highest Indications of Decline Due to Local Factors, 2023
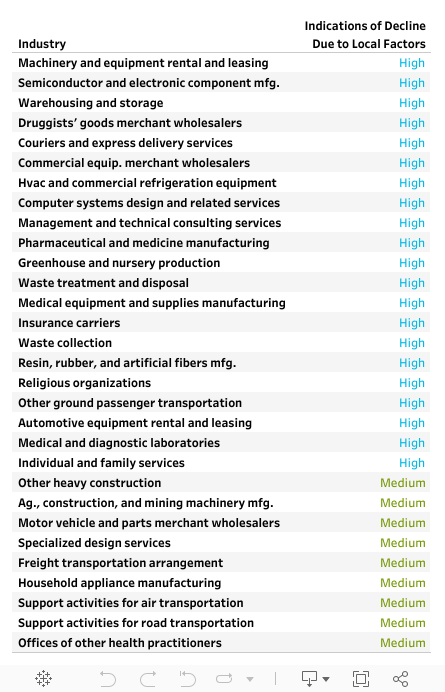
Source: U.S. Bureau of Labor Statistics
This table only includes 4-digit NAICS code industries with over 50 employees.