

Resident Characteristics
This chapter describes characteristics of Chester County's residents, who may work in the county or commute out of the county for work.
Population Change
Since 1970, Chester County has led Southeastern PA's population growth. The county is expected to continue leading in this growth through 2050.
Over the past several decades, Chester County has consistently been ranked as either the highest or nearly the highest in terms of annual population increase. Chester County underwent a 35.5 percent growth boom from 1970 to 2000, increasing from 277,746 to 376,396 residents. The county continued to grow from 2000 to 2020, increasing by 29.5 percent up to 534,413 residents.
The most current DVRPC forecast projects that the 2050 population will be 634,011, an increase of 99,598 (18.6 percent) residents from the enumerated 2020 Census population. However, the DVRPC projection was completed before COVID, and may not account the slowing of growth associated with the pandemic.
Figure 1 — Total Population
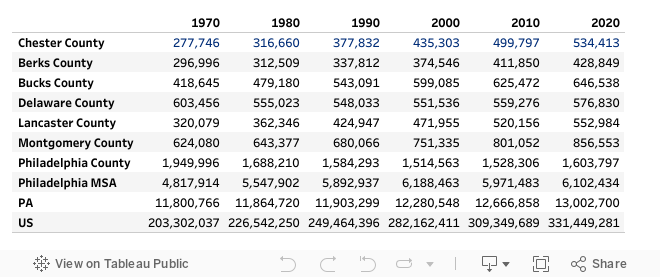
Source: Decennial Census
Figure 2 — County Percent of MSA and PA Population
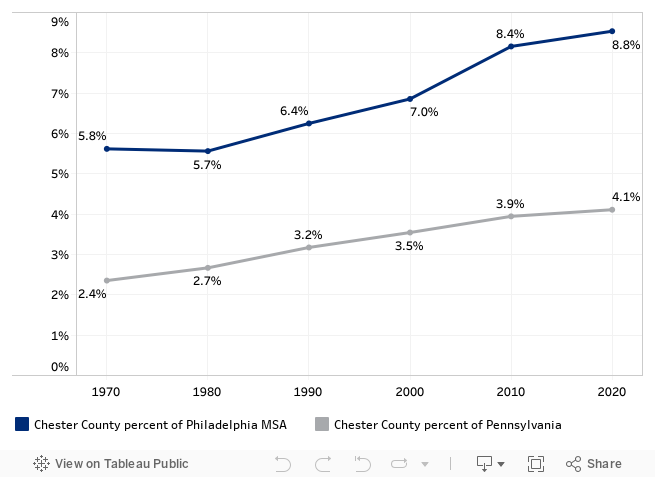
Source: Decennial Census
Figure 3 — Population Change
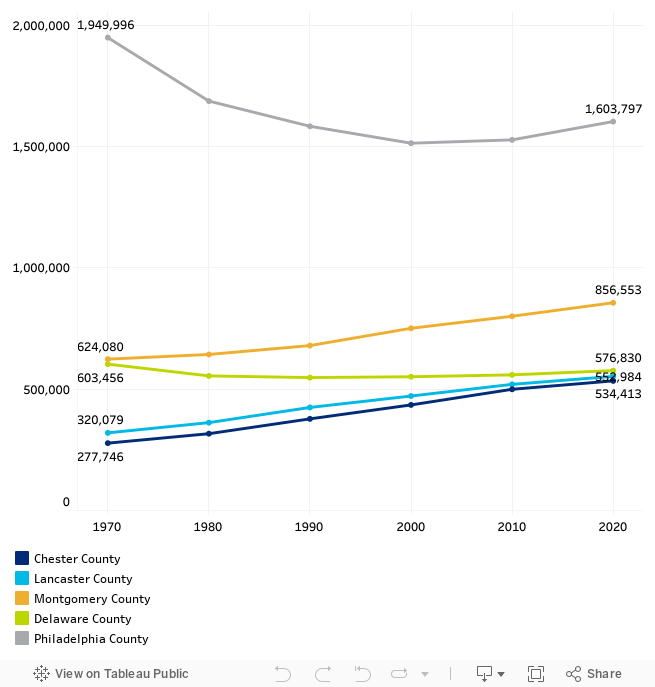
Source: Decennial Census
Figure 4 — Rate of Population Change
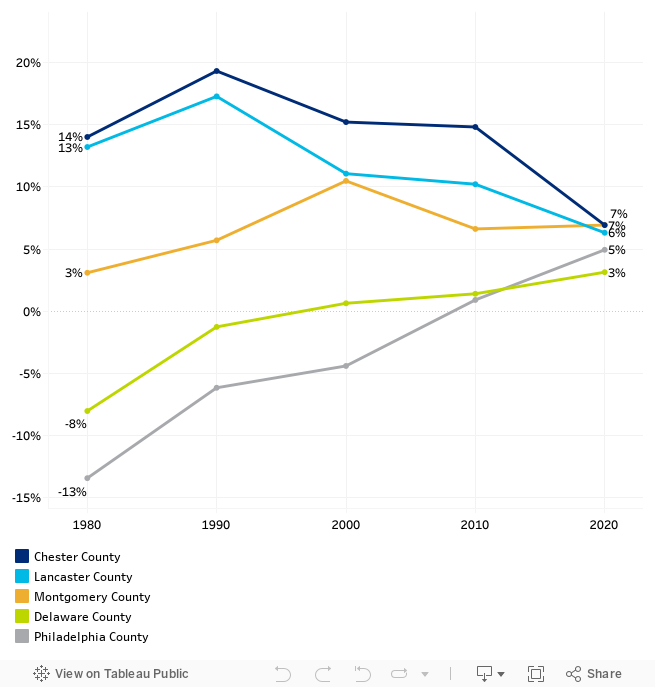
Source: Decennial Census
Labor Force Participation
Chester County has the highest rate of workforce participation in Southeastern PA.
Chester County, has the second highest labor force participation rate (67 percent compared to Montgomery County's 68 percent) when compared with the region, state, or nation, which reflects the county's prosperity and job opportunities. Previously, the labor force participation rate was the highest in the region for five years from 2020-2024.
Figure 5 — Labor Force Participation
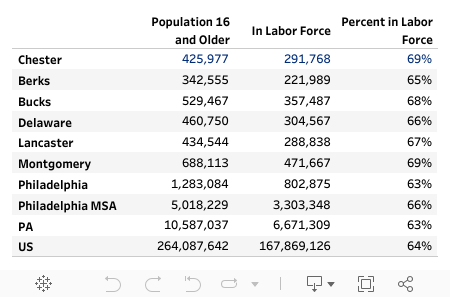
Source: ACS 1-Year, 2024
Figure 6 — Change in Labor Force
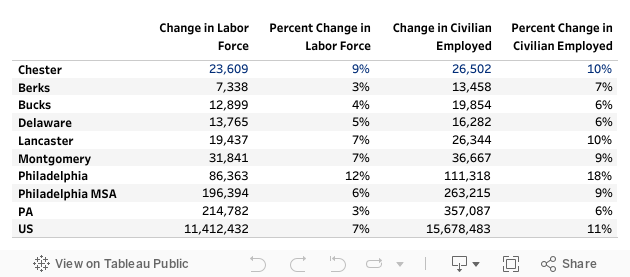
Source: ACS 1-Year, 2024
Unemployment Rates
Chester County has historically had one of the lowest unemployment rates in Pennsylvania.
Chester County has consistently had lower unemployment rates than Philadelphia, Pennsylvania, the United States, and its neighboring counties. Although Chester County's unemployment rate increased during disruptions caused by COVID-19, Chester County had the lowest rate of increase in Southeast Pennsylvania.
Chester County's 2024 annual average unemployment rate was 2.8 percent, slightly lower than pre-pandemic levels. The unemployment rate pre COVID-19 levels ranged from 2.7 percent to 3.3 percent in 2019.
Figure 7 — Unemployment Rates
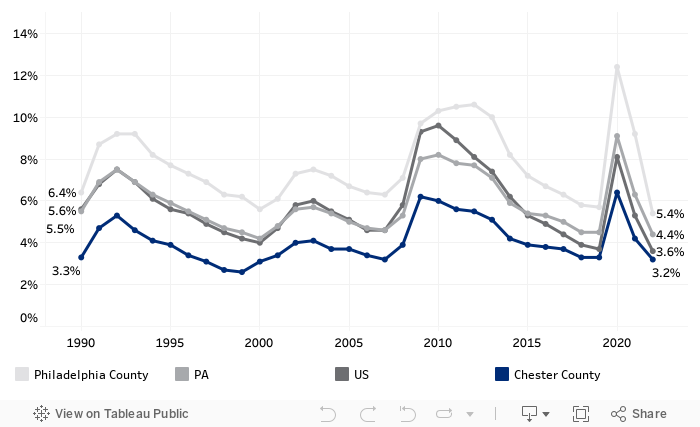
Source: U.S. Bureau of Labor Statistics
Occupations
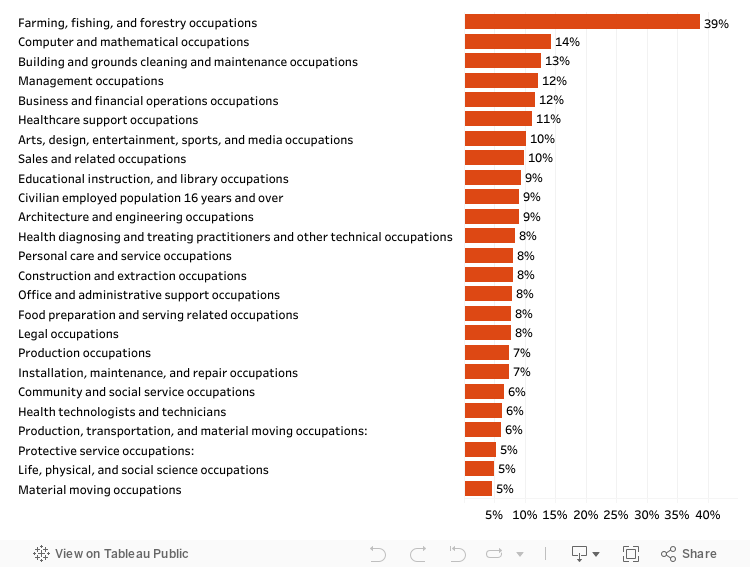
Most Chester County residents are employed in professional and business occupations.
A total of 66 percent of Chester County residents are employed in computer, management, business, sales, office, and education occupations. While only 1,516 residents are employed in farming, fishing, and forestry occupations, they make up 25 percent of the region's residents working in these industries. The share of the region's residents in agriculture has been decreasing, down from 50 percent in 2018, driven primarily by employment losses in the mushroom industry.
Figure 8 — Resident Occupations
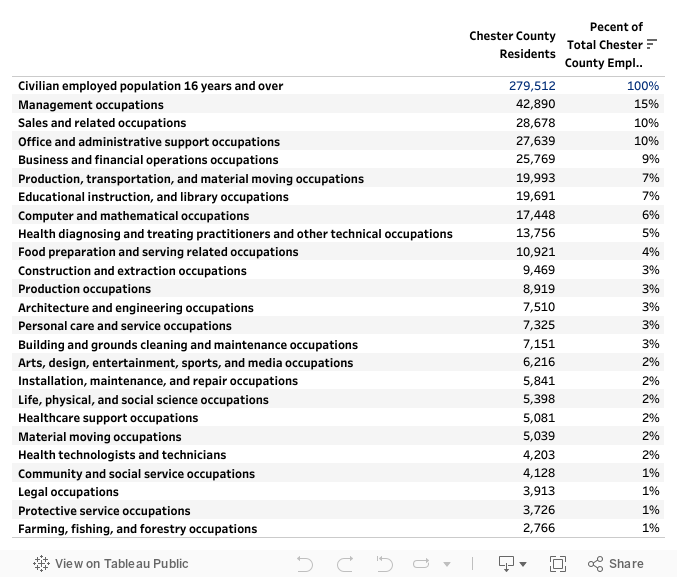
Source: ACS 1-Year, 2024
Figure 9 — Resident Occupations as a Share of Philadelphia MSA
Source: ACS 5-Year, 2022
Commuting Patterns
More workers commute into the county than live and work in the county.
Chester County's workforce is strongly linked to the rest of the Philadelphia region, as well as the Wilmington, Delaware area. Unlike many nearby counties, Chester County has a balance between residents who commute out of the county for work (149,290) and workers who commute into the county (152,784). However, Chester County’s workforce primarily lives outside of the county, with 152,784 workers commuting in and 111,648 workers living in the county.
Data for commuting data comes from the Census Longitudinal Employer-Household Dynamics Origin-Destination Employment Statistics (LODES) data, which releases one year behind other Census data.
Figure 10 — Commuter Patterns
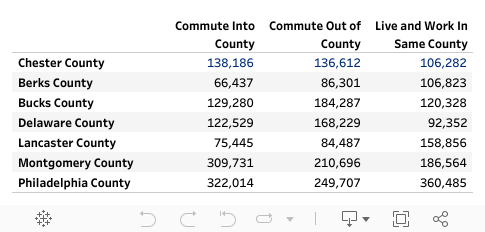
Source: U.S.Census Bureau, Center for Economic Studies, LEHD
Figure 11 — Commuter Patterns Comparison
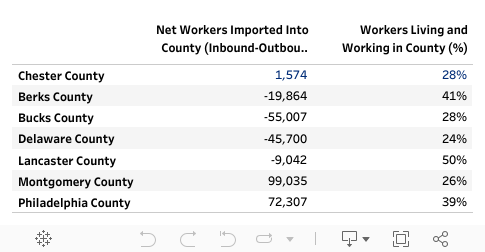
Figure 12 — Chester County Daily Commuting Flows
Source: U.S.Census Bureau, Center for Economic Studies, LEHD
Household Income
Chester County has one of the highest median household incomes in the state.
Chester County has high household income compared to both Pennsylvania and the Philadelphia region. This reflects the high-paying professions of the county's residents and relatively high labor force participation. High housing costs also contribute to the high median income as lower income households are increasingly priced-out of the county. Chester County's median household income has been increasing — from $99,119 in 2018 to $131,424 in 2024.
Figure 13 — Chester County Household Income
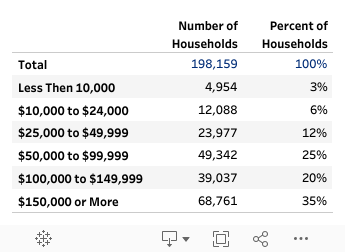
Source: ACS 1-Year, 2024
Figure 14 — Median Household Income Comparison
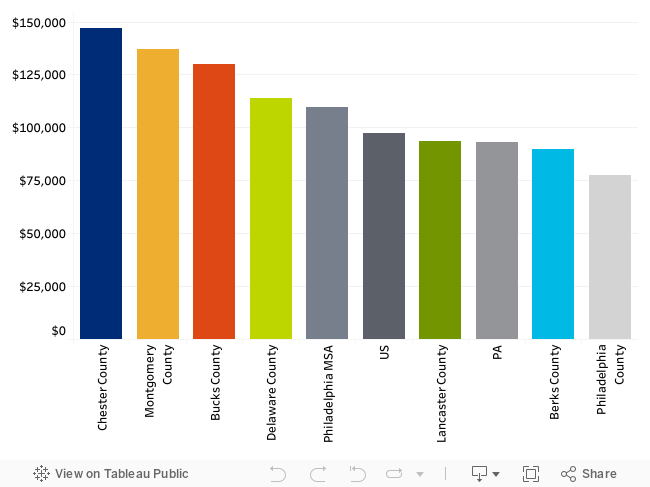
Source: ACS 1-Year, 2024
Education and Race
Chester County has a greater percent of residents with a bachelors degree or higher than other local counties.
Chester County residents are highly educated; 54 percent of those 18 and older have a bachelor's degree or above. The educational attainment may correspond with the high income and managerial occupations of residents.
Figure 15 — Regional Education Attainment

Source: ACS 1-Year, 2024
Chester County has a predominantly white population. The percentages of the population that are Black or African American are low compared to the Philadelphia-Camden-Wilmington MSA, Pennsylvania, and the US, while the percentages for all other races remain comparable. The percentage of the population that is of Hispanic or Latino Origin is lower than for the Philadelphia-Camden-Wilmington MSA and US, but it is comparable with that of Pennsylvania.
Figure 16 — Race and Hispanic Origin
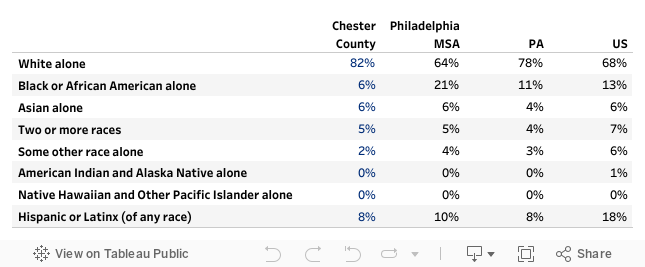
Source: US Census