

Housing Report — New Housing Units Sales
Home » Planning Topics » Housing » Housing Report » New Housing Units Sales
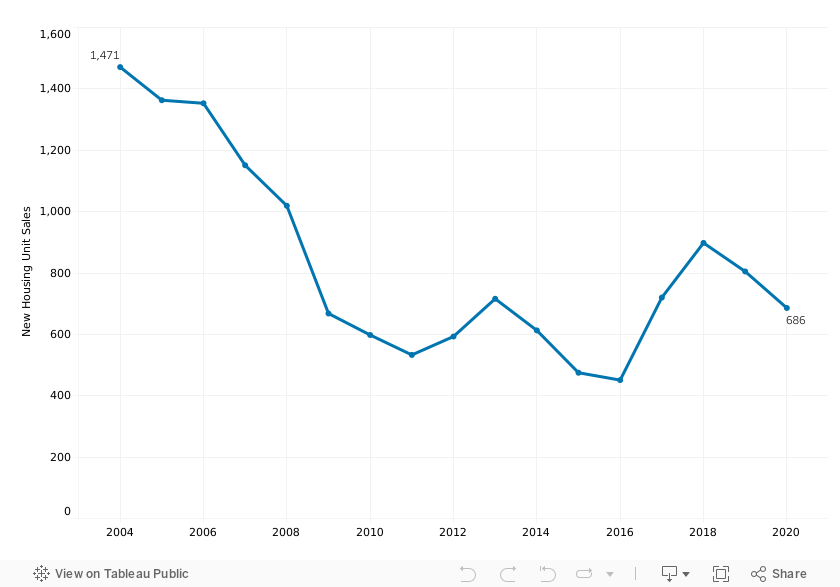
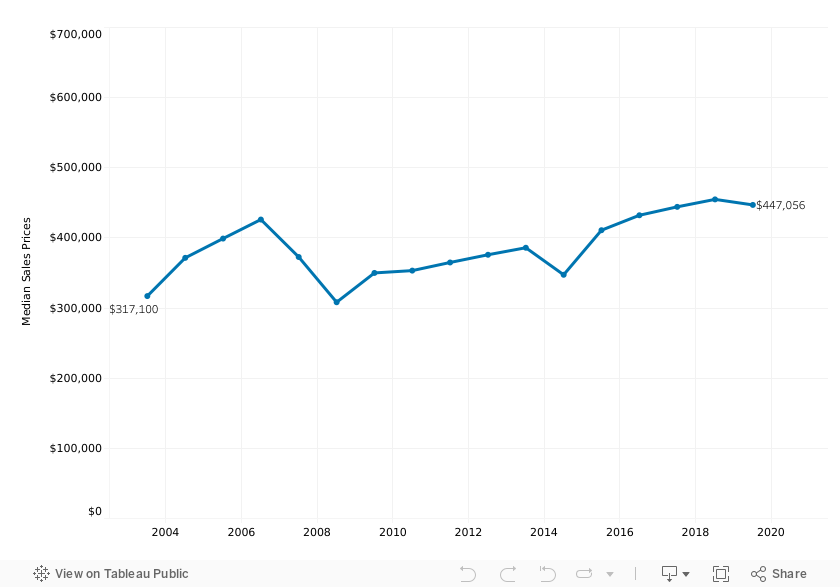
From 2019 to 2020 the number of new home sales decreased by 24%, and the median sale price decreased by 2%.
New housing unit sales are presented from 2004, the year the Planning Commission began calculating data for new housing. Adjusting for inflation, median sale price decreased by 4% from 2019 to 2020.
| Year | Number of Sales |
Percent Change |
Median Sale Price |
Percent Change |
Median Sale Price Inflation Adjusted |
Percent Change |
|---|---|---|---|---|---|---|
| 2004 | 1,471 | N/A | $317,100 | N/A | $437,458 | N/A |
| 2005 | 1,363 | -7.3% | $371,600 | 17.2% | $502,685 | 14.0% |
| 2006 | 1,353 | -0.7% | $399,100 | 7.4% | $519,194 | 3.3% |
| 2007 | 1,151 | -14.9% | $426,200 | 6.8% | $543,175 | 4.6% |
| 2008 | 1,019 | -11.5% | $372,800 | -12.5% | $455,617 | -16.1% |
| 2009 | 668 | -34.4% | $308,300 | -17.3% | $376,676 | -17.3% |
| 2010 | 598 | -10.5% | $350,100 | 13.6% | $416,802 | 10.7% |
| 2011 | 533 | -10.9% | $353,400 | 0.9% | $413,976 | -0.7% |
| 2012 | 593 | 11.3% | $365,000 | 3.3% | $415,412 | 0.3% |
| 2013 | 716 | 20.7% | $376,000 | 3.0% | $421,214 | 1.4% |
| 2014 | 613 | -14.4% | $386,000 | 2.7% | $425,695 | 1.1% |
| 2015 | 475 | -22.5% | $347,450 | -10.0% | $383,523 | -9.9% |
| 2016 | 451 | -5.1% | $411,000 | 18.3% | $447,526 | 16.7% |
| 2017 | 720 | 59.6% | $432,305 | 5.2% | $459,243 | 2.6% |
| 2018 | 898 | 24.7% | $444,305 | 2.8% | $462,417 | 0.7% |
| 2019 | 805 | -10.4% | $454,936 | 2.4% | $466,248 | 0.8% |
| 2020 | 686 | -23.6% | $447,056 | -1.7% | $447,056 | -4.1% |
Of 73 municipalities in Chester County, 19% had more than 20 new unit sales, 11% 10-20, 40% 1-10, and 22% no new unit sales. West Bradford had the highest number of new unit sales, with 72 new units sold in 2020. Western Chester County had fewer new units sold.
For Chester County new home sales median prices, 1% were under $200,000, 21% were $200,000 to $299,999, 25% were $300,000 to $399,999, and 53% were over $400,000. Many municipalities had median sales prices of over $600,000 for new homes (Charlestown, East Pikeland, Easttown, Malvern, Pennsbury, Thornbury, Tredyffrin, Uwchlan, and Westtown), which likely impacted the overall median new home sales price. East Whiteland, East Nottingham, and West Chester had the largest decreases in median sale price for new units.
After a low of 451 new home sales in 2016, new home sales saw large increases through 2018. Although new housing unit sales dropped 34% from 2018 to 2020, 2020 new housing unit sales remain nearly 50% higher than the 2016 low with 686 units sold.
Median sale prices of new housing units in Chester County have been trending upwards since 2008. The median new unit sale price reached a high of $454,936 in 2019, then decreased slightly to $447,056 in 2020.
Of the 686 new unit home sales in Chester County, 57% were sold between $250,000-$499,999. The number of new unit sales in the most affordable price range of less than $250,000, decreased from 34 units in 2018 to 13 in 2019, then further decreased in 2020 to nine units, making up just 1% of all new housing sales.
| Price Range | 2020 Number All Sales |
2020 Percent All Sales |
2019 Number All Sales |
2019 Percent All Sales |
|---|---|---|---|---|
| Less than $250,000 | 0 | 1% | 13 | 2% |
| $250,000 - $499,999 | 394 | 57% | 450 | 56% |
| $500,000 - $749,999 | 207 | 30% | 273 | 34% |
| $750,000 - $899,999 | 34 | 5% | 41 | 5% |
| $900,000 - $1,499,999 | 37 | 5% | 25 | 3% |
| $1,500,000 and over | 5 | 1% | 3 | 0% |
| Total | 686 | 100.0% | 805 | 100.0% |
Downingtown, West Goshen, East Coventry, and East Fallowfield had the highest increases in the number of new housing sales. East Whiteland, West Vincent, and East Pikeland had the largest decreases in number of new home sales.
Malvern, Tredyffrin, and Willistown all had the highest increases in median sales price for new units. East Whiteland, East Nottingham, and West Chester had the largest decreases in median sale price for new units. Median sales price for municipalities with three or fewer sales of new homes in 2020 were omitted.
| Municipality | 2020 New Units, Number of Sales |
2020 New Units, Median Price |
2019 New Units, Number of Sales |
2019 New Units, Median Price |
Change in Number of Units, 2019-2020 |
Change in Median Price 2019-2020 |
|---|---|---|---|---|---|---|
| Atglen | 1 | * | 0 | * | 1 | * |
| Avondale | 0 | * | 0 | * | 0 | * |
| Birmingham | 1 | * | 0 | * | 1 | * |
| Caln | 2 | * | 3 | * | -1 | * |
| Charlestown | 17 | $570,607.00 | 31 | $630,517 | -14 | * |
| Coatesville | 0 | * | 3 | * | -3 | * |
| Downingtown | 29 | $488,398.00 | 0 | * | 29 | * |
| East Bradford | 1 | * | 1 | * | 0 | * |
| East Brandywine | 31 | $409,990.00 | 55 | $439,737 | -24 | $(10,000) |
| East Caln | 26 | $364,905.00 | 6 | $419,990 | 20 | * |
| East Coventry | 29 | $275,190.00 | 3 | * | 26 | $(131,944) |
| East Fallowfield | 27 | $382,674.00 | 5 | $407,134 | 22 | * |
| East Goshen | 0 | * | 2 | * | -2 | * |
| East Marlborough | 23 | $459,990.00 | 11 | $467,985 | 12 | * |
| East Nantmeal | 2 | * | 0 | * | 2 | * |
| East Nottingham | 4 | $365,007.50 | 14 | $377,590 | -10 | $(261,143) |
| East Pikeland | 33 | $627,425.00 | 63 | $626,150 | -30 | * |
| East Vincent | 1 | * | 2 | * | -1 | * |
| East Whiteland | 48 | $519,900.00 | 116 | $479,373 | -68 | $(550,050) |
| Easttown | 3 | * | 4 | $1,069,950 | -1 | * |
| Elk | 0 | * | 1 | * | -1 | * |
| Elverson | 1 | * | 0 | * | 1 | * |
| Franklin | 0 | * | 3 | * | -3 | * |
| Highland | 0 | * | 0 | * | 0 | * |
| Honey Brook Boro. | 1 | * | 0 | * | 1 | * |
| Honey Brook Twp | 6 | $281,855.00 | 4 | $269,000 | 2 | $(87,893) |
| Kennett Square | 0 | * | 2 | * | -2 | * |
| Kennett Township | 19 | $368,700.00 | 32 | $369,748 | -13 | $(100,231) |
| London Britain | 0 | * | 0 | * | 0 | * |
| London Grove | 17 | $507,204.00 | 10 | $468,931 | 7 | * |
| Londonderry | 7 | $426,640.00 | 11 | $424,845 | -4 | * |
| Lower Oxford | 1 | * | 1 | * | 0 | * |
| Malvern | 4 | $710,000.00 | 2 | * | 2 | $372,099 |
| Modena | 0 | * | 0 | * | 0 | * |
| New Garden | 18 | $376,761.50 | 16 | $337,901 | 2 | * |
| Newlin | 1 | * | 4 | $423,890 | -3 | * |
| New London | 0 | * | 0 | * | 0 | * |
| North Coventry | 1 | * | 0 | * | 1 | * |
| Oxford | 4 | $277,882.50 | 5 | $308,000 | -1 | $1,693 |
| Parkesburg | 1 | * | 0 | * | 1 | * |
| Penn | 6 | $300,762.50 | 7 | $276,190 | -1 | $(60,110) |
| Pennsbury | 0 | * | 1 | * | -1 | * |
| Phoenixville | 9 | $369,900.00 | 4 | $360,873 | 5 | $65,280 |
| Pocopson | 0 | * | 0 | * | 0 | * |
| Sadsbury | 30 | $307,450.00 | 37 | $304,620 | -7 | * |
| Schuylkill | 1 | * | 2 | * | -1 | * |
| South Coatesville | 0 | * | 1 | * | -1 | * |
| South Coventry | 1 | * | 4 | $255,500 | -3 | * |
| Spring City | 0 | * | 0 | * | 0 | * |
| Thornbury | 2 | * | 0 | * | 2 | * |
| Tredyffrin | 31 | $711,975.00 | 26 | $634,984 | 5 | $311,984 |
| Upper Oxford | 0 | * | 0 | * | 0 | * |
| Upper Uwchlan | 46 | $410,525.50 | 66 | $399,992 | -20 | * |
| Uwchlan | 2 | * | 1 | * | 1 | * |
| Valley | 2 | * | 1 | * | 1 | * |
| Wallace | 10 | $589,922.00 | 4 | $528,298 | 6 | $49,442 |
| Warwick | 0 | * | 1 | * | -1 | * |
| West Brandford | 72 | $364,767.50 | 74 | $540,480 | -2 | * |
| West Brandywine | 12 | $425,599.00 | 2 | $441,116 | 10 | $30,029 |
| West Caln | 0 | * | 0 | * | 0 | * |
| West Chester | 11 | $410,255.00 | 37 | $395,570 | -26 | $(153,676) |
| West Fallowfield | 0 | * | 1 | * | -1 | * |
| West Goshen | 42 | $719,971.00 | 13 | $563,931 | 29 | * |
| West Grove | 0 | * | 0 | * | 0 | * |
| West Marlborough | 0 | * | 0 | * | 0 | * |
| West Nantmeal | 1 | * | 1 | * | 0 | * |
| West Nottingham | 0 | * | 1 | * | -1 | * |
| West Pikeland | 2 | * | 0 | * | 2 | * |
| West Sadsbury | 1 | * | 1 | * | 0 | * |
| West Vincent | 0 | * | 39 | $394,080 | -39 | * |
| West Whiteland | 29 | $535,668.00 | 40 | $520,209 | -11 | $(12,167) |
| Westtown | 7 | $680,044.00 | 13 | $655,424 | -6 | $680,044 |
| Willistown | 10 | $1,287,962.50 | 18 | $547,835 | -8 | $1,287,963 |
| Chester County | 804 | $355,000 | 898 | $444,305 | -94 | $(89,305) |