
Housing Report — County Data
Home » Planning Topics » Housing » Housing Report » County Data
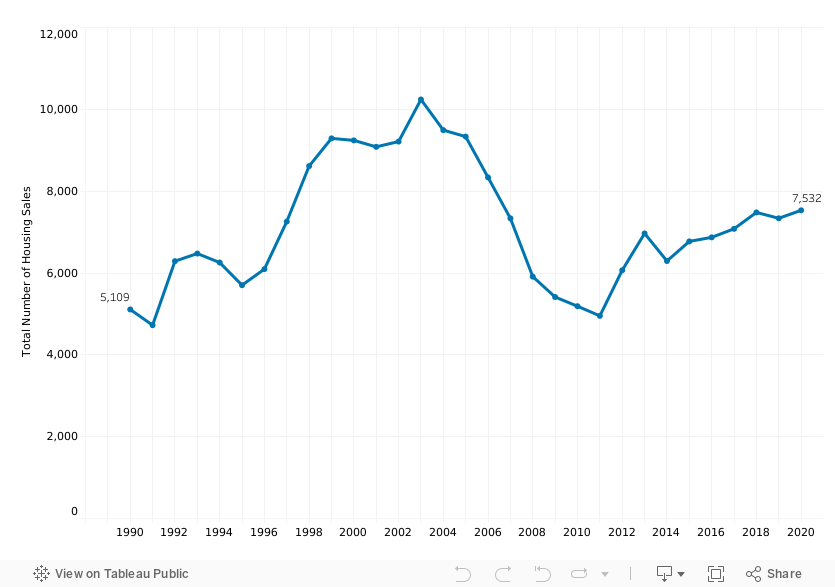
The volume of sales in 2020 increased modestly from 2019, to the highest number of sales since 2006. From 1999 to 2005, sales were at peak levels in excess of 9,000 units per year. Sales decreased after the 2008 recession, but have been rebounding and trending upwards. An increase of sales is thought to have occurred due to COVID-19 purchasing trends. This trend is expected to continue through 2021.
| Year | Number of Sales |
Percent Change |
Median Sale Price |
Percent Change |
Median Sale Price Inflation Adjusted to 2019 |
Percent Change |
|---|---|---|---|---|---|---|
| 2020 | 7,532 | 0.7% | $375,064 | 5.7% | $375,064 | 3.1% |
| 2019 | 7,337 | -1.9% | $355,000 | 4.4% | $363,827 | 2.8% |
| 2018 | 7,480 | 5.6% | $340,000 | 0.9% | $353,860 | -1.2% |
| 2017 | 7,080 | 3.0% | $337,000 | 6.5% | $357,999 | 3.9% |
| 2016 | 6,871 | 1.5% | $316,500 | 2.1% | $344,628 | 0.7% |
| 2015 | 6,772 | 7.6% | $310,000 | -1.6% | $342,185 | -1.5% |
| 2014 | 6,293 | -9.7% | $315,000 | 6.1% | $347,393 | 4.4% |
| 2013 | 6,967 | 14.8% | $297,000 | 5.1% | $332,714 | 3.5% |
| 2012 | 6,067 | 22.5% | $282,500 | -2.6% | $321,518 | -5.4% |
| 2011 | 4,952 | -4.5% | $290,000 | -1.7% | $339,708 | -3.3% |
| 2010 | 5,188 | -4.2% | $295,000 | 6.6% | $351,204 | 3.9% |
| 2009 | 5,413 | -8.4% | $276,700 | -7.8% | $338,067 | -7.8% |
| 2008 | 5,911 | -19.4% | $300,000 | -4.0% | $366,644 | -7.9% |
| 2007 | 7,335 | -12.0% | $312,500 | 3.2% | $398,269 | 1.1% |
| 2006 | 8,336 | -10.7% | $302,800 | 2.6% | $393,916 | -1.3% |
| 2005 | 9,333 | -1.7% | $295,000 | 11.3% | $399,064 | 8.1% |
| 2004 | 9,492 | -7.3% | $265,000 | 8.2% | $369,127 | 6.1% |
| 2003 | 10,240 | 11.2% | $245,000 | 8.9% | $347,842 | 6.2% |
| 2002 | 9,212 | 1.4% | $224,900 | 12.5% | $327,598 | 11.2% |
| 2001 | 9,083 | -1.7% | $200,000 | 6.4% | $294,656 | 2.6% |
| 2000 | 9,241 | -0.5% | $188,000 | 5.0% | $287,314 | 2.2% |
| 1999 | 9,290 | 7.9% | $179,000 | 5.3% | $281,052 | 3.6% |
| 1998 | 8,613 | 18.7% | $170,000 | 0.6% | $271,380 | -1.0% |
| 1997 | 7,257 | 19.1% | $169,000 | 8.2% | $274,023 | 5.0% |
| 1996 | 6,095 | 6.9% | $156,250 | 0.8% | $261,062 | -1.9% |
| 1995 | 5,702 | -8.9% | $155,000 | 0.0% | $266,038 | -2.7% |
| 1994 | 6,256 | -3.4% | $155,000 | 2.6% | $273,499 | 0.1% |
| 1993 | 6,475 | 3.0% | $151,000 | 0.7% | $273,167 | -2.5% |
| 1992 | 6,289 | 33.1% | $150,000 | 2.7% | $280,200 | 0.1% |
| 1991 | 4,725 | -7.5% | $146,000 | -2.0% | $279,820 | -7.3% |
| 1990 | 5,109 | -15.6% | $149,000 | 2.8% | $293,167 | N/A |
There were 7,532 total sales in 2020. Home sales peaked in 2003 at 10,240, before declining to a low of 4,952 sales in 2011. Sales have been generally increasing since the 2011 low. The number of 2020 sales was a slight increase (0.7%) from 2019.
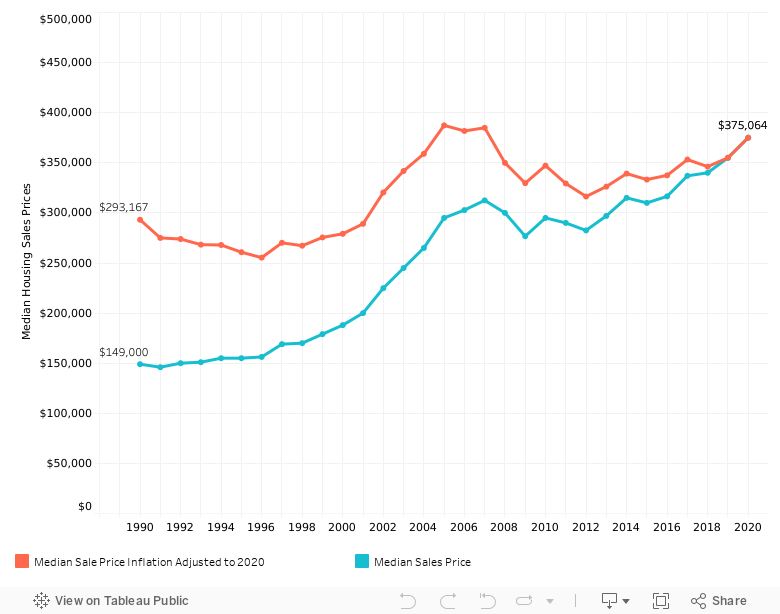
Both raw and inflation adjusted median sales prices saw significant increases during the early 2000s, then decreased from 2008 to 2009, likely due to the 2008 recession. The raw median home sale price continued to increase from 2010 to 2020.
The inflation adjusted median sales price had been remaining steady from 2010 to 2019, but increased in 2020. Inflation adjusted median home sale prices since 1990 have only been higher than 2020 in 2005 and 2007.
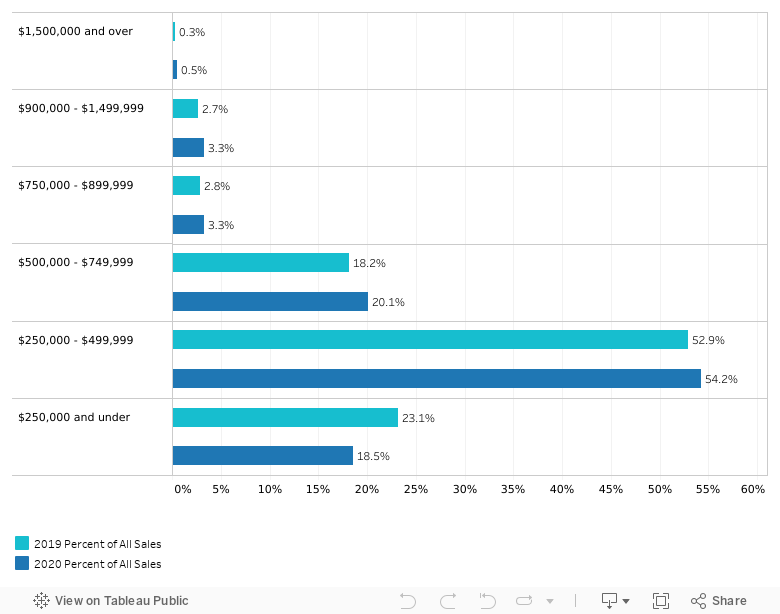
Home sales under $250,000, the most affordable range, continued to decrease in 2020. In 2020, the $250,000 to $499,999 range remained the range with the largest number of home sales at 54.2% of Chester County homes sales. The number of homes sales over $750,000 increased to 7.1% in 2020, up from 5.8% in 2019.
| Home Sale Price Range | 2019 All Sales | 2019 Percent of All Sales | 2020 All Sales | 2020 Percent of All Sales |
|---|---|---|---|---|
| Less than $250,000 | 1,697 | 23.1% | 1,395 | 18.5% |
| $250,000 - $499,999 | 3,880 | 52.9% | 4,085 | 54.2% |
| $500,000 - $749,999 | 1,335 | 18.2% | 1,517 | 20.1% |
| $750,000 - $899,999 | 207 | 2.8% | 249 | 3.3% |
| $900,000 - $1,499,999 | 197 | 2.7% | 245 | 3.3% |
| $1,500,000 and over | 21 | 0.3% | 41 | 0.5% |
| Total | 7,337 | 100.0% | 7,532 | 100.0% |
The share of home sales increased in higher price ranges from 2019 to 2020. The $250,000-$499,999 range increased in share by 1.4%, $500,000-$749,999 increased by 1.9%. The most affordable, less than $250,000, range decreased in share by 4.6%.