
Housing Report — County Data — 2019
Home » Planning Topics » Housing » Housing Report — 2019 » County Data
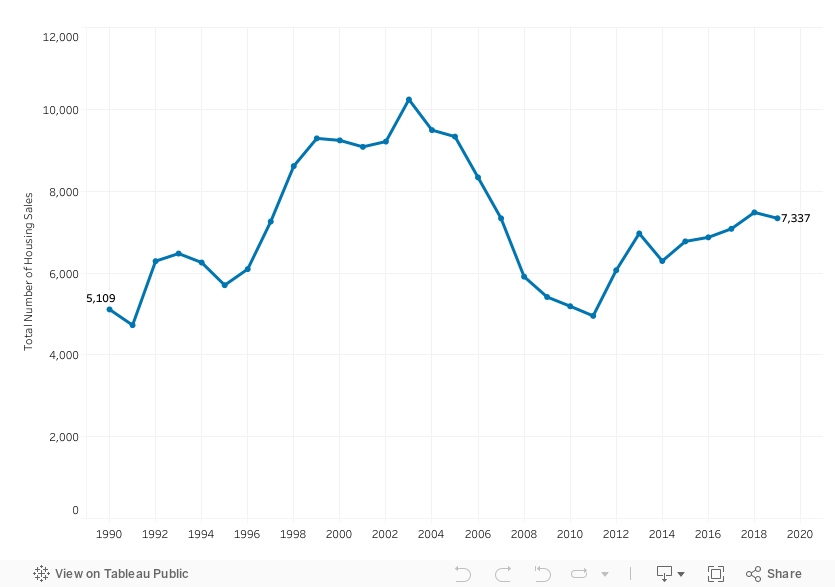
The volume of sales in 2019 declined modestly from 2018. From 1999 to 2005, sales were at peak levels in excess of 9,000 units per year. Sales decreased post the 2018 recession, but have been rebounding and trending upwards.
| Year | Number of Sales |
Percent Change |
Median Sale Price |
Percent Change |
Median Sale Price Inflation Adjusted to 2019 |
Percent Change |
|---|---|---|---|---|---|---|
| 2019 | 7,337 | -1.9% | $355,000 | 4.4% | $355,000 | 2.6% |
| 2018 | 7,480 | 5.6% | $340,000 | 0.9% | $346,158 | -2.0% |
| 2017 | 7,080 | 3.0% | $337,000 | 6.5% | $353,224 | 4.7% |
| 2016 | 6,871 | 1.5% | $316,500 | 2.1% | $337,469 | 1.3% |
| 2015 | 6,772 | 7.6% | $310,000 | -1.6% | $333,273 | -1.8% |
| 2014 | 6,293 | -9.7% | $315,000 | 6.1% | $339,222 | 4.0% |
| 2013 | 6,967 | 14.8% | $297,000 | 5.1% | $326,211 | 3.1% |
| 2012 | 6,067 | 22.5% | $282,500 | -2.6% | $316,368 | -3.9% |
| 2011 | 4,952 | -4.5% | $290,000 | -1.7% | $329,341 | -5.1% |
| 2010 | 5,188 | -4.2% | $295,000 | 6.6% | $347,177 | 5.3% |
| 2009 | 5,413 | -8.4% | $276,700 | -7.8% | $329,662 | -5.8% |
| 2008 | 5,911 | -19.4% | $300,000 | -4.0% | $349,926 | -9.1% |
| 2007 | 7,335 | -12.0% | $312,500 | 3.2% | $384,919 | 0.8% |
| 2006 | 8,336 | -10.7% | $302,800 | 2.6% | $381,767 | -1.4% |
| 2005 | 9,333 | -1.7% | $295,000 | 11.3% | $387,351 | 7.9% |
| 2004 | 9,492 | -7.3% | $265,000 | 8.2% | $358,982 | 5.0% |
| 2003 | 10,240 | 11.2% | $245,000 | 8.9% | $341,815 | 6.7% |
| 2002 | 9,212 | 1.4% | $224,900 | 12.5% | $320,393 | 10.8% |
| 2001 | 9,083 | -1.7% | $200,000 | 6.4% | $289,094 | 3.6% |
| 2000 | 9,241 | -0.5% | $188,000 | 5.0% | $279,139 | 1.3% |
| 1999 | 9,290 | 7.9% | $179,000 | 5.3% | $275,502 | 3.1% |
| 1998 | 8,613 | 18.7% | $170,000 | 0.6% | $267,261 | -1.1% |
| 1997 | 7,257 | 19.1% | $169,000 | 8.2% | $270,158 | 5.8% |
| 1996 | 6,095 | 6.9% | $156,250 | 0.8% | $255,345 | -2.1% |
| 1995 | 5,702 | -8.9% | $155,000 | 0.0% | $260,777 | -2.7% |
| 1994 | 6,256 | -3.4% | $155,000 | 2.6% | $267,981 | -10.0% |
| 1993 | 6,475 | 3.0% | $151,000 | 0.7% | $268,297 | -2.1% |
| 1992 | 6,289 | 33.1% | $150,000 | 2.7% | $273,919 | -40.0% |
| 1991 | 4,725 | -7.5% | $146,000 | -2.0% | $275,032 | -6.2% |
| 1990 | 5,109 | -15.6% | $149,000 | 2.8% | $293,167 | N/A |
The total number of sales in 2019 was 7,337. The number of sales peaked in 2003 at 10,240, before declining to a low of 4,952 sales in 2011. Sales have ben mostly increasing since the 2011 low. The total number of sales in 2019 was 7,337, a slight 1.9% decrease from 2018 sales.
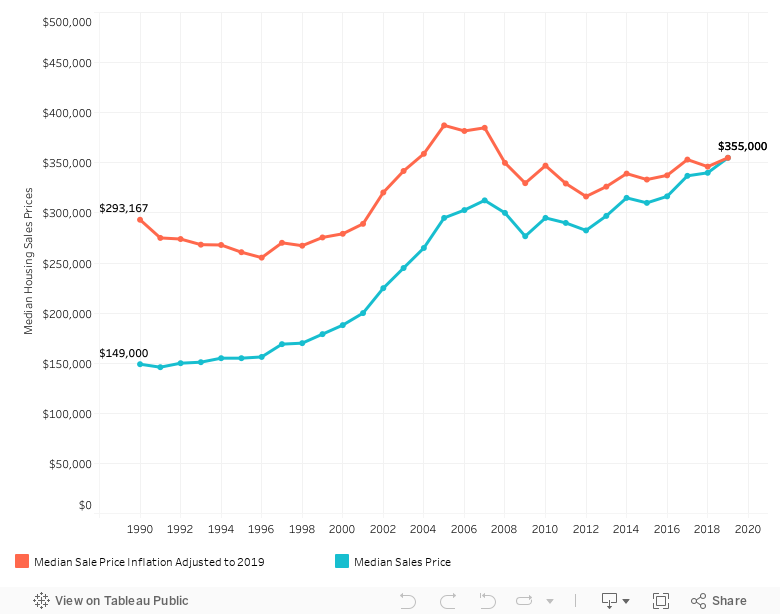
Both raw and inflation adjusted median sales prices saw significant increases during the early 2000s, then decreased from 2008 to 2009, likely due to the 2008 recession. The raw median home sale price continued to increase from 2010 to 2019. The inflation adjusted median sales price has remained steady from 2010 to 2019.
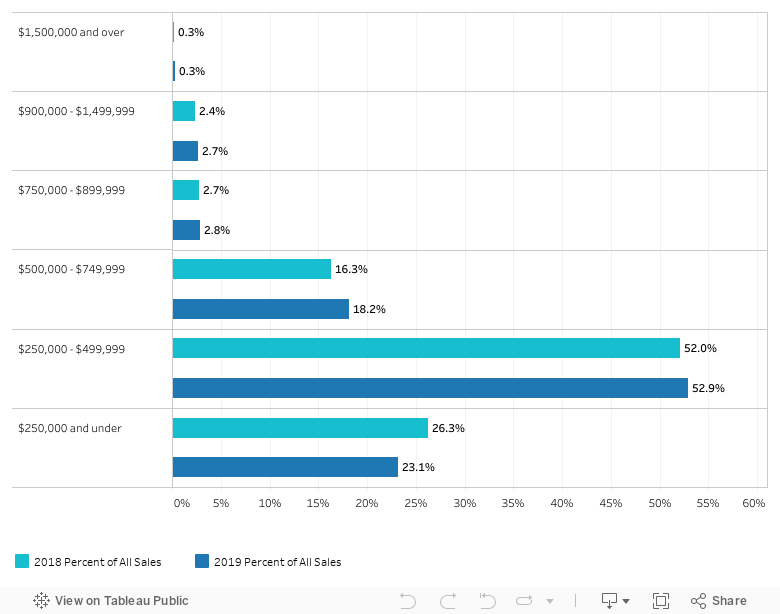
2019 saw a decrease in home sales less than $250,000, the most affordable range. In 2019, the $250,000 - $499,999 range had the largest number of home sales at 52.9% of Chester County homes sales. Only 5.8% of sales sold at $750,000 and over.
| Home Sale Price Range | 2019 All Sales | 2019 Percent of All Sales | 2018 All Sales | 2018 Percent of All Sales |
|---|---|---|---|---|
| Less than $250,000 | 1,697 | 23.1% | 1,966 | 26.3% |
| $250,000 - $499,999 | 3,880 | 52.9% | 3,892 | 52.0% |
| $500,000 - $749,999 | 1,335 | 18.2% | 1,218 | 16.3% |
| $750,000 - $899,999 | 207 | 2.8% | 205 | 2.7% |
| $900,000 - $1,499,999 | 197 | 2.7% | 180 | 2.4% |
| $1,500,000 and over | 21 | 0.3% | 19 | 0.3% |
| Total | 7,337 | 100.0% | 7,480 | 100.0% |
The share of home sales remained largely the same from 2018 to 2019. The $250,000-$499,999 range increased in share by 1.9%. The most affordable, less than $250,000 range, decreased in share by 3.2%.