Measuring Progress
It takes time to successfully implement a long-range plan like Landscapes3 and, no matter how well a community might plan, there are very strong outside market, environmental, cultural, and political forces that heavily impact what actually happens on the ground. Nevertheless, it is important to measure what is occurring to get a better picture if trends are moving in the right direction or not.
Overall, most trends are moving in the right direction, but this is not the case for every trend.
Preserve Goal Metrics
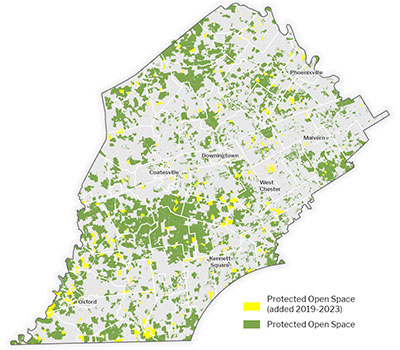
The Preserve Goal is focused on open space preservation, and the county has made excellent progress on this goal, with the amount of preserved open space in the county rising from 28.8% of the county’s land area to 31.1%, which shows nearly half a percent being preserved each year. Although the amount of land being preserved each year is not as great as in prior decades, there is slow steady progress on preservation despite increasing competition for land.
Farmland preservation is the largest element of open space preservation nowadays, with over half of the county’s farmland now permanently protected.
Another key element of open space preservation is its connectivity, which is critical for environmental, scenic, and trail purposes. Over the past five years, the county’s open space has become more connected, with over 42% of the county’s conservation corridor land area now permanently preserved.
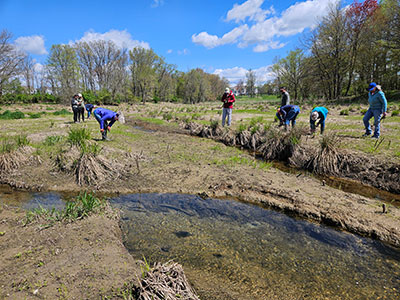
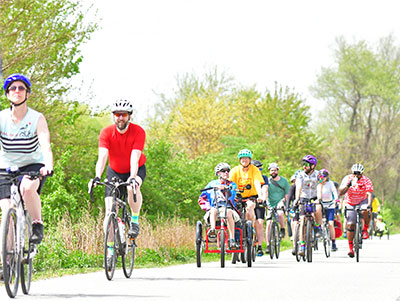
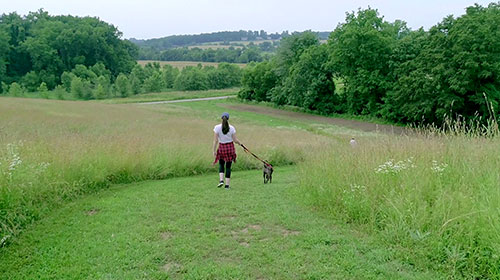
Photo credit: Craig Thomas, CCWRA
Protect Goal Metrics
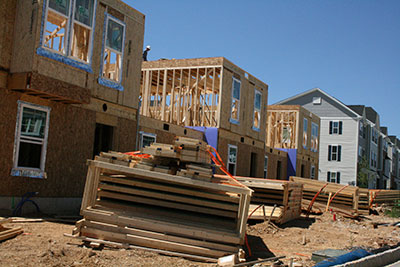
The protect goal is focused on the protection of natural resources. With new development across the county and over 5,000 acres of greenfield development during the past five years, there most likely has been a negative impact on the county’s natural resources, although, nowadays, new development often protects some of these resources. On the other hand, ongoing open space preservation has permanently protected many natural resource areas.
During the past five years, many municipalities have strengthened their natural resource protection ordinances, and the number of effective natural resource protection standards has increased from 203 to 212.
Our stream's health has essentially stayed the same, bouncing around from year to year, often depending on the severity of local storms.
Appreciate Goal Metrics
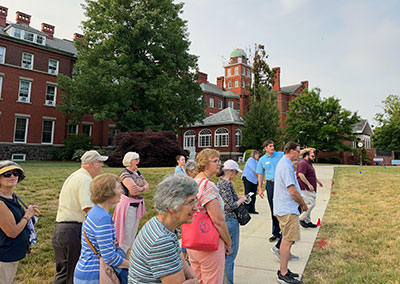
The appreciate goal is focused on historic preservation, which, with the nation's upcoming 250th commemoration, has drawn renewed attention. There is a new America250PA Chester County committee working on this anniversary, and the county adopted a Heritage Tourism Plan in early 2024.
Over the past five years, many municipalities have strengthened their heritage protection measures, with the number of adopted measures increasing from 142 to 158.
With the pandemic, historic tourism has been all over the place, with significant drops at one point, followed by a surge in attendance, leading to a 35% increase from 2019 through 2023.
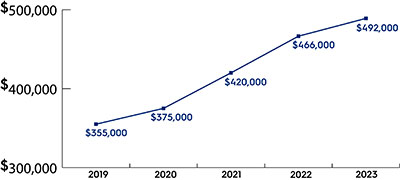
The median sales price of homes sold in Chester County rose from $355,000 in 2019 to $492,000 in 2023.
Live Goal Metrics
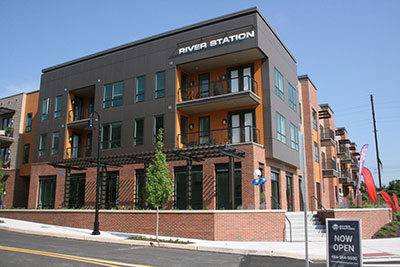
The live goal focuses on local communities, with an emphasis on housing. Generally, the county's communities have continued to strengthen their sense of place, provision of community facilities, and housing choices.
The housing picture is truly a mixed bag. On the one hand, the county's housing stock has become more diverse, reflecting changing lifestyles and household composition. From 2019 through 2023, 36% of the residential units built were apartments, 32% were attached homes, and 32% were single-family detached homes. In 2018, according to the US Census, 60% of the county’s homes were single-family detached; so, the new housing construction is making the county's overall housing stock more diverse.
During these years, hundreds of affordable housing units were built, which is helpful but does not compensate for the huge run-up in housing costs from 2019 to 2023. In fact, the median sales price of homes sold in Chester County rose from $355,000 in 2019 to $492,000 in 2023, an astounding 39% increase over 5 years. Housing, which was already expensive, has gotten extremely expensive.
Looking at other elements of the Live Goal, there were a lot of improvements to local community facilities, with many new and improved schools, municipal buildings, and parks. The share of the county’s population within a half mile of a park rose from 70% to 78%.
For solid waste, there was a slight decline in per capita waste generation.
Prosper Goal Metrics
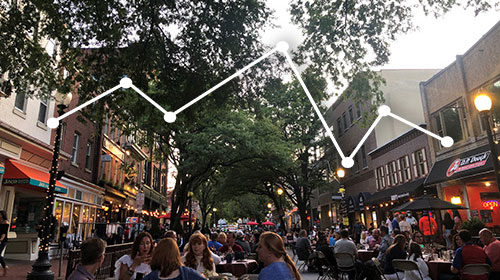
The prosper goal focuses on economic development, which the pandemic drastically affected in 2020. Overall, the county's economy has been resilient, which is partially due to its diversity and underlying strength. In addition, the county's urban centers have continued to revitalize, with Phoenixville experiencing tremendous growth and Coatesville seeing significant new investment.
New nonresidential construction has been moderate, with a little over a million square feet built per year. Institutional construction has constituted the largest share of this construction. With the pandemic and work from home, office construction has dried up, while industrial construction has increased compared to prior years.
Investment in urban centers has been strong, which is reflected in the change in assessed value. In the county's sixteen urban centers, the assessed value of all properties increased 2.8% from 2019 through 2023 while the county as a whole only increased 0.9%.
Workforce development became a real challenge during the pandemic, and major changes were made to the County programs that assisted and provided training opportunities to those in need of work. These redesigns took time and have recently begun making progress.
Connect Goal Metrics
The connect goal focuses on transportation and infrastructure, and a strong base is being laid for future transportation improvements because of federal infrastructure legislation. With the shift to remote work, the transportation picture is mixed.
Public transportation ridership is down significantly, reflecting national and regional trends. On the other hand, vehicle driving times are also down, making the drive to work faster for most people.
The active transportation network has continued to expand, with 66 more miles of sidewalks in the county and 5 more miles of regional trails.
Public utilities have primarily been going where they should — growth areas. Over 92% of the homes proposed over the past five years have had appropriate sewer and water infrastructure.
5 Year Assessment of Landscape3
Metrics Overview